 > System >Operations > Logs > Log Files.
 PegaDiagnosticUser role in the web.xml file. Consult the Installation Guide for more information and instructions. The Alert log, which is a series of text files, supplements the Pega logs (console logs). Typically, an Alert log file is named PegaRULES-Alert-YYYY-MMM-DD.log, where the date portion of the name indicates the date when the application server was started on the node. Security alerts are recorded in a similar file named PegaRULES-AlertSecurity-YYYY-MM-DD.log.
You can view the current Alert log or download the current Alert Log from the server to your workstation.
> System >Operations > Logs > Log Files. PegaDiagnosticUser role in the web.xml file. Consult the Installation Guide for more information and instructions. To view only those alerts from your own requestor session, select Alerts from the Designer Studio toolbar. See Working with the My Alerts display.
The table below describes the Pega 7 alert categories. Threshold settings in the prconfig.xml file or Prconfig Dynamic System Settings affect the operation and criteria of many alerts. For detailed information about every field reported by each alert category, see PDN article Performance alerts, security alerts, and AES.
The Alert log may contain any of the following alerts; the category description appears on the My Alerts display.
ID |
Category |
Message text and description |
| PEGA0001 | Browser Interaction | Browser interaction time has exceeded a threshold setting. See How to monitor interactive response times. |
| PEGA0002 | DB Commit Time | Database commit operation has exceeded a threshold setting. See How to detect lengthy PegaRULES database operations. |
| PEGA0003 | DB Rollback Time | Database rollback operation has exceeded a threshold setting. See How to detect lengthy PegaRULES database operations. |
| PEGA0004 | DB Bytes Read | Total BLOB column sizes in a single HTTP interaction was larger than expected. See How to detect when total BLOB column sizes in an a single HTTP interaction exceed a threshold. |
| PEGA0005 | DB Time | Database query operation has exceeded an elapsed time threshold setting. See How to detect lengthy PegaRULES database operations. |
| PEGA0008 | PRPC Started | PegaRULES engine successfully started. |
| PEGA0009 | PRPC Failed Start | PegaRULES engine failed to initialize. |
| PEGA0010 | Agent Disabled | Agent processing disabled because of execution errors. |
| PEGA0011 | Service Total Time | Services — One of five time thresholds was exceeded during a service execution. See Testing Services and Connectors on the Integration page of the PDN. |
| PEGA0016 | Cache Reduced | The number of records in the rule assembly cache, a personal cache, or a property conclusion cache has reached or exceeded about 75% of the limit specified in the prconfig.xml file or Dynamic System Setting. This causes the system to invalidate older entries in the cache, making room for newer ones. See Understanding caching. |
| PEGA0017 | Cache Force Reduced | The number of records in the rule assembly cache, a personal cache, or a property conclusion cache has reached or exceeded a limit specified in the prconfig.xml file. This causes the system to immediately invalidate older entries in the cache, making room for additions. See Understanding caching. |
| PEGA0018 | PRThreads Limit | Number of PRThreads has exceeded the threshold for a requestor. |
| PEGA0019 | Long Requestor | The master agent has detected a long-running requestor session. See How to detect long-running interactions. |
| PEGA0020 | Connect Total Time | A connector call to an external system has exceeded an elapsed time threshold. See How to detect lengthy connector executions and Testing Services and Connectors, located on the Integration page of the PDN. |
| PEGA0021 | Declarative Page Memory | The total of shared memory to store Node-scope data pages has exceeded a threshold. See More about Data Page rules. |
| PEGA0022 | Rule Cache Disabled | The rules cache was disabled, typically by an administrator using the System Management Application. |
| PEGA0023 | Rule Cache Enabled | The rules cache was enabled, typically by an administrator using the System Management application. |
| PEGA0024 | Loading Declarative Network | Loading declarative network has exceeded an elapsed time threshold. See How to detect large declarative networks. |
| PEGA0025 | Reading Blob Need Columns | A list operation (for example, an Obj-Browse method) accessed properties within the Storage Stream (BLOB) column, that is, properties not exposed as individual columns. |
| PEGA0026 | Database Connection Time | The elapsed time taken to acquire a database connection exceeded a threshold. See How to detect long database connection waits. |
| PEGA0027 | DB Rows Returned | A list operation returned many rows. See How to detect database list operations that return many rows. |
| PEGA0028 | JVM Garbage Collection | Collection usage threshold exceeded for long-lived object memory pool. A garbage collection operation completed, but did not free sufficient virtual memory. |
| PEGA0029 | HTML Stream Size | An HTML stream sent to the browser exceeds 2,000 kilobytes (or another threshold setting). See How to detect large HTML streams. |
| PEGA0030 | Requestor Limit | The number of requestors on a system node exceeds 200 (or another threshold setting). See How to detect when the number of requestors exceeds the threshold. |
| PEGA0031 | Stream Overwritten | A generated HTML stream was overwritten without being sent to the browser client. See How to detect when a generated stream was overwritten but never sent. |
| PEGA0032 | Invalidated Rules | Rule change invalidated the specified threshold of entries in the Rule Assembly cache. See How to detect when a rule change invalidates many entries in the Rules Assembly cache. |
| PEGA0033 | DB Query Length | Database query length has exceeded the specified threshold. See How to detect when the database query length has exceeded a specified threshold. |
| PEGA0034 | Declare Index | The number of declare indexes in a single interaction exceeded threshold. See How to detect when the number of declare indexes exceed a threshold. |
| PEGA0035 | Clipboard List Size | A Page List property contains more than a specified threshold number of elements. See How to detect when a Page List property has a number of elements that exceed a threshold. |
| PEGA0036 | PRPC Shutdown | The PegaRULES engine was shut down as the result of an administrative action. |
| PEGA0037 | Rule Assembly Time | Total rule assembly process took more time than expected. See How to detect when total rule assembly time exceeds a threshold. |
| PEGA0038 | Cache Find Synch Time | Cache find synchronization time is longer than expected. See How to detect when the wait time for access to the Rule Assembly cache has exceeded a threshold. |
| PEGA0039 | Blob Size Read | The size of a BLOB column read from the database was larger than expected. See How to detect when the size of a BLOB column read exceeds a threshold. |
| PEGA0040 | Blob Size Written | The size of a BLOB column saved to the database was larger than expected. See How to detect that the size of a saved BLOB column exceeds a threshold. |
| PEGA0041 | Work Object PR_OTHER | A work item was saved to pr_other table. See How to detect when a work item is saved to the pr_other table. |
| PEGA0042 | DB Time | Elapsed time for a database query, until the last rows are received at the server. See How to detect lengthy PegaRULES database operations. |
| PEGA0043 | ADP Queue Waiting | Queue waiting time is more than the specified value. |
| PEGA0044 | Throttle Alerts | An alert indicating that a time limit has been exceeded, such as "Reached threshold limit for message ID: PEGA0037, will send again after Thu Aug 16 12:40:44 EDT 2012 ". |
| PEGA0045 | ADP Duplicate Request | A new request has been submitted for a page without using the existing one. |
| PEGA0046 | ADP Queue Not Started | Queue entry not yet started by the load activity. |
| PEGA0047 | ADP Copy Too Long | Page copy time is more than the loader activity execution time for the data page. |
| PEGA0048 | ADP Copy Wait Too Long | Page copy time and waiting time are more than the loader activity execution time for the data page. |
| PEGA0049 | Search Status Check | The alert identifies that there is a problem with the Elasticsearch Index, and that search results may therefore not be accurate. |
| PEGA0050 | Lightweight list | Lightweight list has been copied n times. See PDN article Understanding the PEGA0050 alert - Lightweight list has been copied n times |
| PEGA0051 | Cross thread deadlock | |
| PEGA0052 | ADP Load Wait Exceeded | See PDN article Understanding the Pega0052 alert: Wait time exceeded for the page ADP to load asynchronously. |
| PEGA0053 | Declare Page Load Frequency | Data page reload exceeded the frequency threshold. See How to detect when a data page reloads too often. |
| PEGA0054 | Elasticsearch Query | Query exceeded the operation time threshold. See How to respond when an Elasticsearch query takes too long. |
| PEGA0055 | Hazelcast clock sync | Clock drift exceeded the configured time threshold. See How to detect when a clock in a node drifts too much. |
| PEGA0056 | Defragment PR_SYS_LOCKS | Defragmentation of the table associated with class System-Locks exceeded the configured time threshold. See How to detect when defragmentation of the table associated with class System-Locks takes too long. |
For additional information about each alert type, see PDN article Performance Alerts, security alerts, and AES.
Note: Four alerts appeared in V5.2 but do not appear in later versions:
ID |
Message text and description |
| PEGA0006 | Discontinued as of V5.4, now reported as PEGA0006 |
| PEGA0013 | Disabled as of V5.3, now reported as PEGA0011. |
| PEGA0014 | Disabled as of V5.3, now reported as PEGA0011. |
| PEGA0015 | Disabled as of V5.3, now reported as PEGA0011. |
Note: Two alerts appeared in V5.3 but do not appear in later versions:
ID |
Message text and description |
| PEGA0006 | Database update operation has exceeded a threshold setting. See How to detect lengthy PegaRULES database operations. Reported as PEGA0005. |
| PEGA0007 | Database operation has exceeded a threshold setting. See How to detect lengthy PegaRULES database operations. Reported as PEGA0005. |
The PegaRULES Log Analyzer (PLA) is a Web application that can parse, consolidate and summarize alert logs.
For basic information on PLA, see PDN articles Understanding the PegaRULES Log Analyzer and How to use the PegaRULES Log Analyzer.
You can use the Pega 7 application Autonomic Event Services (AES), Enterprise Edition to parse, consolidate and summarize alert logs.
See PDN articles How to perform log analysis in Autonomic Event Services (AES) Enterprise Edition
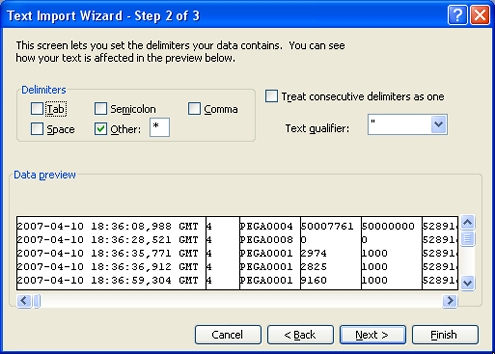
Fields in the Alert log are separated by an asterisk character. You can import the Alert log into Microsoft Excel for viewing, searching, sorting, or other analysis:
PEGA-ALERT-ZZZZ.log file and click Open. The Text Import Wizard starts.
Note: Access the PDN to obtain the latest copy of the Alerts.xls Excel template. This can speed and simplify parsing and summarizing Alert logs.
Each line of the log contains multiple fields, delimited by a single asterisk character. Each line contains these fields. The first column identifies the Excel column after import.
Col |
Field |
Description |
| A | Timestamp | Date and time of the alert event in UTC format. |
| B | Version | "6" for PRPC V5.4+. (Alert logs produced by 5.1 and 5.2 have "2" or "3" in this field, and fewer fields in each row.) |
| C | Message ID | Identifier of alert type, for example PEGA0011. |
| D | KPI Value | Observed duration in milliseconds or count of value, known as the key performance indicator. |
| E | KPI Threshold | Threshold value for this alert type, in milliseconds or count. |
| F | ServerID | Node ID for the node that is the source of the alert event. |
| G | Requestor ID | Session identifier; the first letter (A, B, H, or P) identifies the requestor type. |
| H | User ID | Operator ID of requestor, or none. |
| I | Work pool | Work pool that the requestor uses, or none. |
| J | Encoded Ruleset | Hash code identifying the requestors ruleset list. |
| K | Checkout Enabled | Y indicates that the activity in the Activity field is in a personal ruleset; that a developer has checked out the activity. |
| L | Interaction number | For alerts from browser sessions, the interaction number (as it appears on the Performance tool display). |
| M | Sequence | Sequence number for this alert in the log; unique within this log. |
| N | Thread | Internal name of the PRThread instance, or NA if this alert is not from a Thread. |
| O | Logger | Java class that produced the alert instance. |
| P | Last Input | For alerts from interactive requestors, a portion of the URL received in the most recent interaction. Typically the text Stream= or Activity= and the name of an activity or stream rule run by the URL. |
| Q | First Activity | For alerts from interactive requestors, the first activity or stream run by this requestor in the current interaction. (This activity or stream may or may not have caused the alert.) |
| R | Last Step | If the First Activity field identifies an activity, this field identifies the step number last completed, when available. |
| S | Trace List | Colon-delimited string containing the most recent 50 operations of this requestor before the alert event. Each operation consists of two subfields in the format number:value:. |
| T | Reserved | Reserved. |
| U | PAL data | For some Message ID types, a set of selected of Performance tool statistics at the time of the alert. A colon delimited string in the format propertyname:value:. Values are in milliseconds, bytes, or counts. |
| V | Line | A text description of the alert. |
Security alerts are recorded in the AlertSecurity log.
ID |
Category |
Message text and description |
| SECU0001 | Security | Security alert. An HTTP request referenced an unexpected property. These can arise from an improperly coded URL JavaServer Page tag. |
| SECU0002 | Security | Security alert. An HTTP POST operation sent an XML document containing clipboard page details from a web node within a Pega Composite Application. |
| SEC0003 | Security | Security alert. A requestor on a web node, within a Pega Composite Application, attempted to execute an activity or list view rule that is not marked for web node execution. The attempt was ignored. |
| SEC0004 | Security | Security alert. A URL received from a web node, within a Pega Composite Application, contained the pyStream parameter. The URL was ignored. |
| SEC0005 | Security | Security alert. A Thread name in the URL of an HTTP request contains invalid characters. See How to detect when a Thread name in a URL contains invalid characters. |
The Alert log identifies the names of activities and other rules executed. By default for alerts of types PEGA0002 to PEGA0007, parameter values and SQL statements containing property values also appear. You can include the suppressInserts and includeParameterPage keyword in the prconfig.xml file so that parameter values and other potentially sensitive data values are omitted in prepared statement inserts:
1. Add the following to the prconfig.xml file:
<env name="alerts/database/operationTimeThreshold/suppressInserts"
value="true" />
<env name="alerts/general/includeParameterPage" value="false" />
2. Stop and restart or redeploy the system.
Note: As an alternative to the prconfig.xml file, you can use Dynamic System Settings to configure your application.
See How to create or update a prconfig setting.
An appender setting in the prlogging.xml file determines the name and existence of the Alert log.
The Alert log supports the optional Autonomic Event Services component, which summarizes and monitors alerts across multiple nodes in a cluster.
See also these PDN articles:
 Concepts